2020年12月30日 星期三

[Docker]Tensorflow-serving

  1. # CPU
  2. # Download the TensorFlow Serving Docker image and repo
  3. docker pull tensorflow/serving:latest-gpu
  1. # GPU
  1. # 建立tf資料夾
  2. mkdir -p $(pwd)/tf
  3. TESTDATA="$(pwd)/tf"
  4.  
  5. ### CPU ###
  6. docker run -t --rm -p 8501:8501 \
  7. --name tf_serving \
  8. -v "$TESTDATA:/models/fashion_model" \
  9. -e MODEL_NAME=fashion_model \
  10. tensorflow/serving &
  11.  
  12. ### GPU ###
  13. docker run -t --runtime=nvidia -p 8501:8501 \
  14. --name tf_serving_gpu \
  15. -v "$TESTDATA:/models/fashion_model" \
  16. -e MODEL_NAME=fashion_model \
  17. tensorflow/serving:latest-gpu &
  1. # Query the model using the predict API
  2. curl -d '{"instances": [1.0, 2.0, 5.0]}' \
  3. -X POST http://localhost:8501/v1/models/half_plus_two:predict
  1. import tensorflow as tf
  2. from tensorflow import keras
  3.  
  4. # Helper libraries
  5. import numpy as np
  6. import matplotlib.pyplot as plt
  7. import json
  8.  
  9. import requests
  10.  
  11. fashion_mnist = keras.datasets.fashion_mnist
  12. (_, _), (test_images, test_labels) = fashion_mnist.load_data()
  13.  
  14. test_images = test_images.reshape(test_images.shape[0], 28, 28, 1)
  15.  
  16. data = json.dumps({"signature_name": "serving_default", "instances": test_images[0:3].tolist()})
  17.  
  18. headers = {"content-type": "application/json"}
  19. json_response = requests.post('http://10.15.11.75:8501/v1/models/fashion_model:predict', data=data, headers=headers)
  20. print(json_response)
  21.  
  22. predictions = json.loads(json_response.text)['predictions']
  23. print(np.argmax(predictions[0]))

2020年11月22日 星期日

[Python]Dataframe GruopBy sum

In [19]:
  1. import pandas as pd
In [20]:
  1. df = pd.read_csv('weather_by_cities.csv')
Out[20]:
day city temperature windspeed event
0 1/1/2017 new york 32 6 Rain
1 1/2/2017 new york 36 7 Sunny
2 1/3/2017 new york 28 12 Snow
3 1/4/2017 new york 33 7 Sunny
4 1/1/2017 mumbai 90 5 Sunny
5 1/2/2017 mumbai 85 12 Fog
6 1/3/2017 mumbai 87 15 Fog
7 1/4/2017 mumbai 92 5 Rain
8 1/1/2017 paris 45 20 Sunny
9 1/2/2017 paris 50 13 Cloudy
10 1/3/2017 paris 54 8 Cloudy
11 1/4/2017 paris 42 10 Cloudy
In [55]:
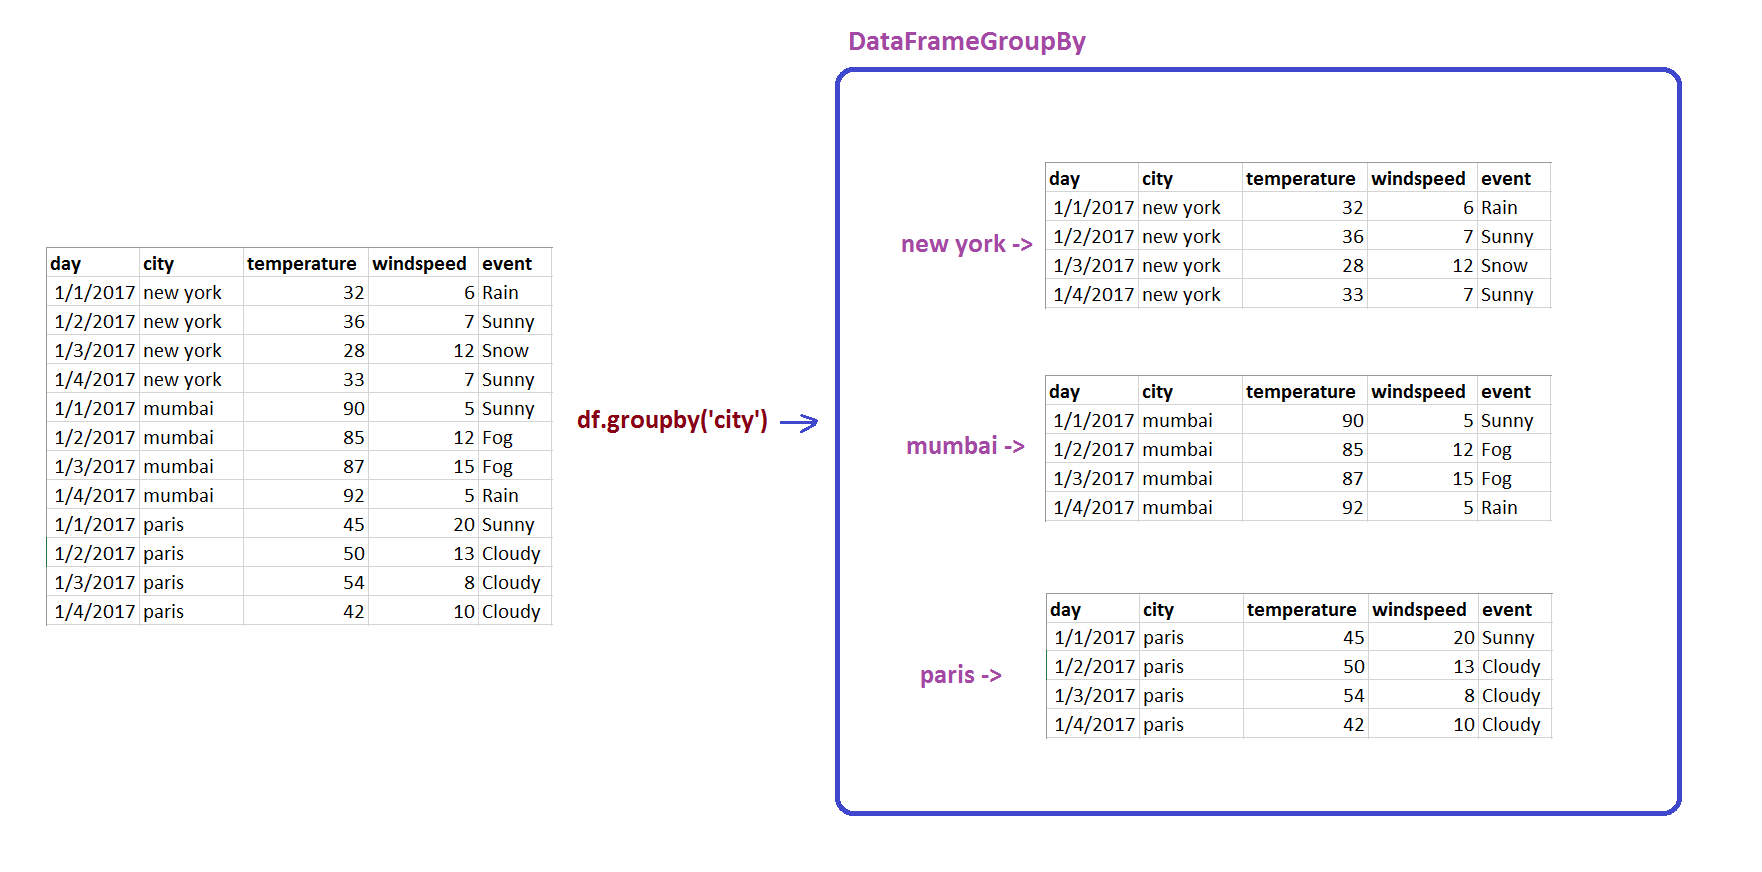
  1. g = df.groupby('city')
  2. g
Out[55]:
  1. <pandas.core.groupby.generic.DataFrameGroupBy object at 0x00000200CAE08588>

Group BY

Group BY

In [56]:
  1. for city, city_df in g:
  2. print(city)
  3. print(city_df)
  1. mumbai
  2. day city temperature windspeed event
  3. 4 1/1/2017 mumbai 90 5 Sunny
  4. 5 1/2/2017 mumbai 85 12 Fog
  5. 6 1/3/2017 mumbai 87 15 Fog
  6. 7 1/4/2017 mumbai 92 5 Rain
  7. new york
  8. day city temperature windspeed event
  9. 0 1/1/2017 new york 32 6 Rain
  10. 1 1/2/2017 new york 36 7 Sunny
  11. 2 1/3/2017 new york 28 12 Snow
  12. 3 1/4/2017 new york 33 7 Sunny
  13. paris
  14. day city temperature windspeed event
  15. 8 1/1/2017 paris 45 20 Sunny
  16. 9 1/2/2017 paris 50 13 Cloudy
  17. 10 1/3/2017 paris 54 8 Cloudy
  18. 11 1/4/2017 paris 42 10 Cloudy
In [48]:
  1. g = df.groupby('city').sum()
Out[48]:
temperature windspeed
city
mumbai 354 37
new york 129 32
paris 191 51
In [23]:
  1. # SELECT * from city_data GROUP BY city
  2. g.get_group('mumbai')
Out[23]:
day city temperature windspeed event
4 1/1/2017 mumbai 90 5 Sunny
5 1/2/2017 mumbai 85 12 Fog
6 1/3/2017 mumbai 87 15 Fog
7 1/4/2017 mumbai 92 5 Rain
In [33]:
  1. g.max()
Out[33]:
day temperature windspeed event
city
mumbai 1/4/2017 92 15 Sunny
new york 1/4/2017 36 12 Sunny
paris 1/4/2017 54 20 Sunny
In [35]:
  1. g.mean()
Out[35]:
temperature windspeed
city
mumbai 88.50 9.25
new york 32.25 8.00
paris 47.75 12.75
In [38]:
  1. g.describe()
Out[38]:
temperature windspeed
count mean std min 25% 50% 75% max count mean std min 25% 50% 75% max
city
mumbai 4.0 88.50 3.109126 85.0 86.50 88.5 90.50 92.0 4.0 9.25 5.057997 5.0 5.00 8.5 12.75 15.0
new york 4.0 32.25 3.304038 28.0 31.00 32.5 33.75 36.0 4.0 8.00 2.708013 6.0 6.75 7.0 8.25 12.0
paris 4.0 47.75 5.315073 42.0 44.25 47.5 51.00 54.0 4.0 12.75 5.251984 8.0 9.50 11.5 14.75 20.0

[Python]Datafram merge (inner join, outer join, left, right)

Pandas Merge Tutorial

Basic Merge Using a Dataframe Column

In [28]:
  1. import pandas as pd
  2. df1 = pd.DataFrame({
  3. "city": ["new york","chicago","orlando"],
  4. "temperature": [21,14,35],
  5. })
  6. df1
Out[28]:
city temperature
0 new york 21
1 chicago 14
2 orlando 35
In [29]:
  1. df2 = pd.DataFrame({
  2. "city": ["chicago","new york","orlando"],
  3. "humidity": [65,68,75],
  4. })
  5. df2
Out[29]:
city humidity
0 chicago 65
1 new york 68
2 orlando 75
In [30]:
  1. df3 = pd.merge(df1, df2, on="city")
  2. df3
Out[30]:
city temperature humidity
0 new york 21 68
1 chicago 14 65
2 orlando 35 75

Type Of DataBase Joins

<img src="db_joins.jpg" height="800", width="800">

In [31]:
  1. df1 = pd.DataFrame({
  2. "city": ["new york","chicago","orlando", "baltimore"],
  3. "temperature": [21,14,35, 38],
  4. })
  5. df1
Out[31]:
city temperature
0 new york 21
1 chicago 14
2 orlando 35
3 baltimore 38
In [32]:
  1. df2 = pd.DataFrame({
  2. "city": ["chicago","new york","san diego"],
  3. "humidity": [65,68,71],
  4. })
  5. df2
Out[32]:
city humidity
0 chicago 65
1 new york 68
2 san diego 71
In [33]:
  1. df3=pd.merge(df1,df2,on="city",how="inner")
  2. df3
Out[33]:
city temperature humidity
0 new york 21 68
1 chicago 14 65
In [34]:
  1. df3=pd.merge(df1,df2,on="city",how="outer")
  2. df3
Out[34]:
city temperature humidity
0 new york 21.0 68.0
1 chicago 14.0 65.0
2 orlando 35.0 NaN
3 baltimore 38.0 NaN
4 san diego NaN 71.0
In [35]:
  1. df3=pd.merge(df1,df2,on="city",how="left")
  2. df3
Out[35]:
city temperature humidity
0 new york 21 68.0
1 chicago 14 65.0
2 orlando 35 NaN
3 baltimore 38 NaN
In [36]:
  1. df3=pd.merge(df1,df2,on="city",how="right")
  2. df3
Out[36]:
city temperature humidity
0 new york 21.0 68
1 chicago 14.0 65
2 san diego NaN 71

indicator flag

In [37]:
  1. df3=pd.merge(df1,df2,on="city",how="outer",indicator=True)
  2. df3
Out[37]:
city temperature humidity _merge
0 new york 21.0 68.0 both
1 chicago 14.0 65.0 both
2 orlando 35.0 NaN left_only
3 baltimore 38.0 NaN left_only
4 san diego NaN 71.0 right_only

suffixes

In [38]:
  1. df1 = pd.DataFrame({
  2. "city": ["new york","chicago","orlando", "baltimore"],
  3. "temperature": [21,14,35,38],
  4. "humidity": [65,68,71, 75]
  5. })
  6. df1
Out[38]:
city humidity temperature
0 new york 65 21
1 chicago 68 14
2 orlando 71 35
3 baltimore 75 38
In [39]:
  1. df2 = pd.DataFrame({
  2. "city": ["chicago","new york","san diego"],
  3. "temperature": [21,14,35],
  4. "humidity": [65,68,71]
  5. })
  6. df2
Out[39]:
city humidity temperature
0 chicago 65 21
1 new york 68 14
2 san diego 71 35
In [40]:
  1. df3= pd.merge(df1,df2,on="city",how="outer", suffixes=('_first','_second'))
  2. df3
Out[40]:
city humidity_first temperature_first humidity_second temperature_second
0 new york 65.0 21.0 68.0 14.0
1 chicago 68.0 14.0 65.0 21.0
2 orlando 71.0 35.0 NaN NaN
3 baltimore 75.0 38.0 NaN NaN
4 san diego NaN NaN 71.0 35.0

join

In [58]:
  1. df1 = pd.DataFrame({
  2. "city": ["new york","chicago","orlando"],
  3. "temperature": [21,14,35],
  4. })
  5. df1.set_index('city',inplace=True)
  6. df1
Out[58]:
temperature
city
new york 21
chicago 14
orlando 35
In [59]:
  1. df2 = pd.DataFrame({
  2. "city": ["chicago","new york","orlando"],
  3. "humidity": [65,68,75],
  4. })
  5. df2.set_index('city',inplace=True)
  6. df2
Out[59]:
humidity
city
chicago 65
new york 68
orlando 75
In [60]:
  1. df1.join(df2,lsuffix='_l', rsuffix='_r')
Out[60]:
temperature humidity
city
new york 21 68
chicago 14 65
orlando 35 75

2020年11月5日 星期四

python-dotenv

安裝python-dotenv套件
  1. $ pip install python-dotenv

.env檔 內容↓↓↓
  1. IP=10.15.10.47
  2. PORT=8080
  3. USER_NAME="ADMIN"
  4. PASSWORD=P@ssw0rd


test_ditenv.py
  1. import os
  2. from dotenv import load_dotenv
  3. load_dotenv()
  1. IP = os.getenv('IP')
  2. PORT = os.getenv('PORT')
  3. USER_NAME = os.getenv('USER_NAME')
  4. PASSWORD = os.getenv('PASSWORD')
  5.  
  6. print(f'IP => {IP} ', type(IP))
  7. print(f'PORT => {PORT} ', type(PORT))
  8. print(f'USER_NAME => {USER_NAME} ', type(USER_NAME))
  9. print(f'PASSWORD => {PASSWORD} ', type(PASSWORD))
IP => 10.15.10.47 <class 'str'>
PORT => 8080 <class 'str'>
USER_NAME => ADMIN <class 'str'>
PASSWORD => P@ssw0rd <class 'str'>

2020年10月22日 星期四

[Docker]不用sudo直接執行docker

Linux使用docker時,需要使用root或是sudo 
作業系統:CentOS 7

⊙ 重啟電腦自動啟動docker
  1. infrada@localhost ~ $ sudo systemctl enable docker.service
1. 建立docker群組
  1. sudo groupadd docker
2. 將使用者加入docker群組中
#user:使用者名稱
  1. sudo usermod -G docker -a #user
加入群組後,若使用者為登入狀態,不會馬上生效
  1. infrada@localhost ~$ groups
  2. wheel infrada
3. 立即生效加入群組中
  1. infrada@localhost ~ $ newgrp docker
  2. infrada@localhost ~ $ groups
  3. docker wheel infrada
4. 重新啟動docker
  1. sudo systemctl restart docker

2020年5月29日 星期五

[Python]Colab讀入載入Google Drive方法

此種方法是最簡單的方法,不需要每次都上傳一次檔案,可以重複使用


  1. # -*- coding: utf-8 -*-
  2. from google.colab import drive
  3. drive.mount('/content/drive')

點擊 URL > 選擇帳戶 > 允許

將驗證碼貼回Coloab內按下Enter送出。
接下來會看到Google Drive的資料夾在左邊那邊長了出來,就可以開始對目錄操作


  1. path = './content/drive/My Drive/
  2. # 後面路徑自己接,就可以直接使用了

2020年4月12日 星期日

Pandas One hot encoding

import pandas as pd
df = pd.DataFrame([
   ['green', 'M', 10.1],
   ['red', 'L', 13.5],
   ['blue', 'XL', 15.3]])
  
df.columns = ['color', 'size', 'prize']
df

[out:]
colorsizeprize
0greenM10.1
1redL13.5
2blueXL15.3
pd.get_dummies(df)
prizecolor_bluecolor_greencolor_redsize_Lsize_Msize_XL
010.1010010
113.5001100
215.3100001